



Paper Packaging Outlook 2027: Five Forces Reshaping Converter Capacity Planning
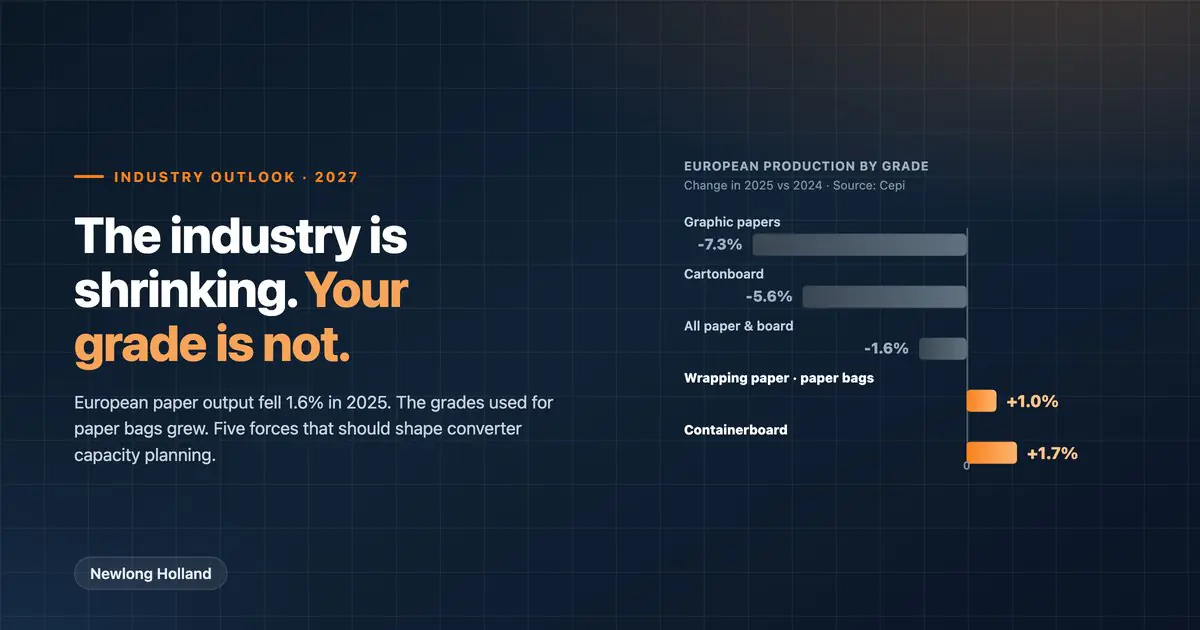
European paper production is shrinking, but the grade that makes paper bags is not. In 2025, total European paper and board output fell 1.6% to 77.4 million tonnes, and the first quarter of 2026 came in a further 2.4% lower, according to Cepi, the Confederation of European Paper Industries. Yet within that decline, production of wrapping paper grades, which Cepi defines as the grades used for paper bag production, rose 1.0%. Over the same year, European paper sack deliveries climbed 2.7% to 5.69 billion units, on EUROSAC figures published in June 2026.
That gap is the single most important fact for anyone setting a 2027 capital budget. The headline number for the paper industry is negative. The number for your grade is positive. A converter who plans capacity against the headline will under-invest in a market that is quietly growing. This article sets out the five forces behind that divergence, each with the data underneath it, and what each one means for a capacity decision you have to make in the next few months.
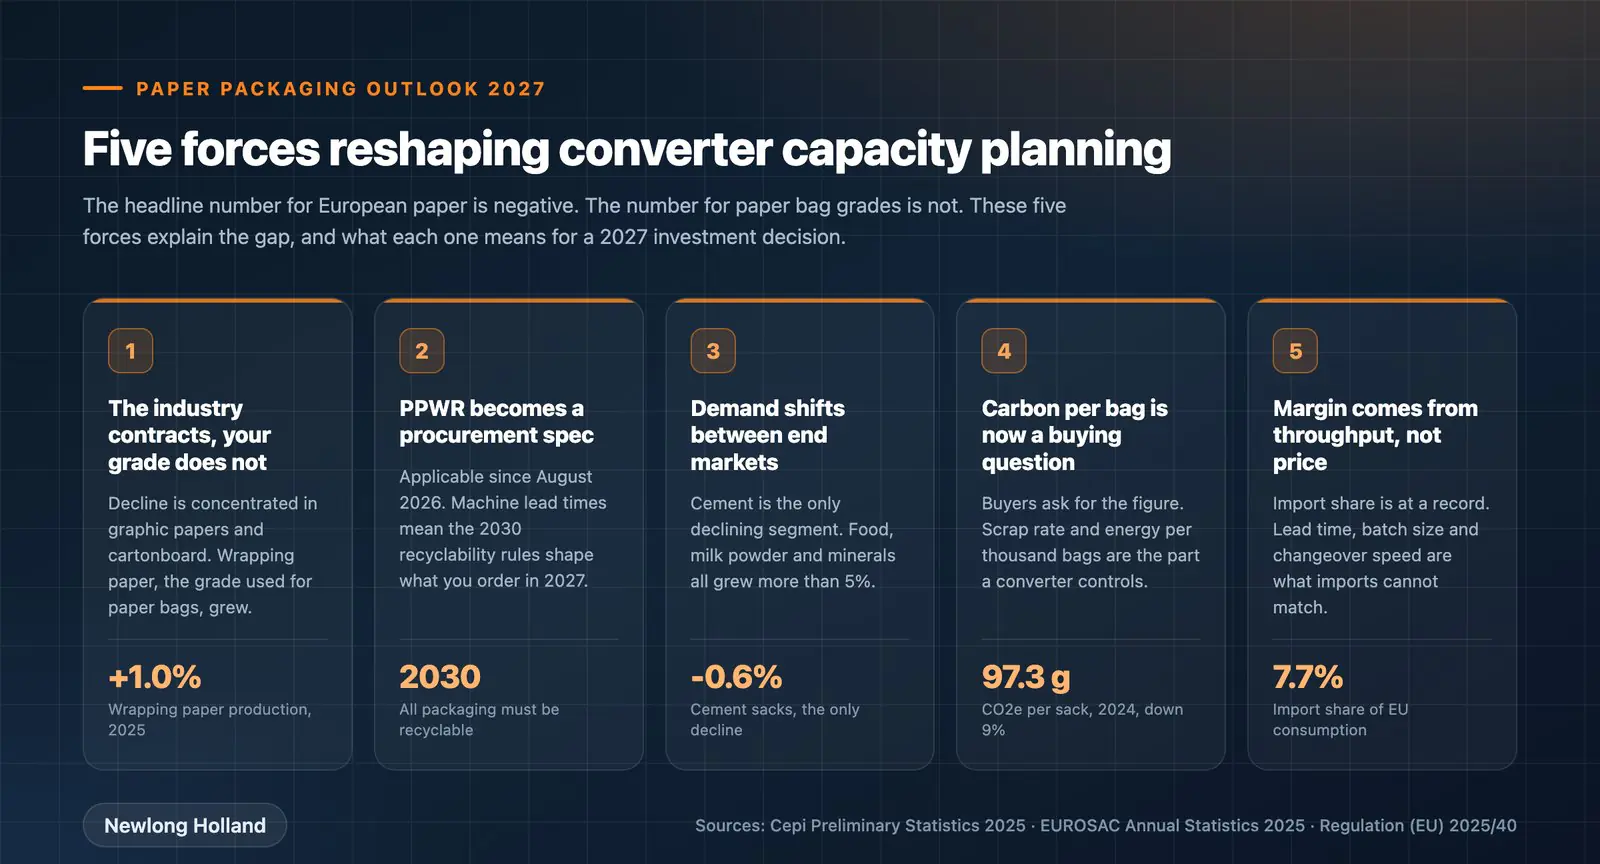
Force 1: the industry is contracting, but your grade is not
The short answer: the decline in European paper is concentrated in graphic papers and cartonboard. Packaging grades were essentially flat, and the bag-making grades grew. Averaging across all grades hides exactly the signal a bag converter needs.
Cepi’s 2025 statistics break the picture down by grade, and the spread between the best and worst performing grades is more than eight percentage points. Graphic papers, the grades used for printing and writing, fell 7.3%, continuing a structural decline driven by digitisation. Cartonboard, used mainly for retail packaging, dropped 5.6%. Against that, packaging grades as a whole moved just 0.2%, containerboard for corrugated boxes gained 1.7%, and wrapping paper grades gained 1.0%.
| European production by grade, 2025 | Change vs 2024 |
|---|---|
| Graphic papers | -7.3% |
| Cartonboard (retail packaging) | -5.6% |
| All packaging grades | +0.2% |
| Wrapping paper grades (paper bag production) | +1.0% |
| Containerboard (corrugated boxes) | +1.7% |
| Total paper and board (77.4 million tonnes) | -1.6% |
The composition of European paper output is shifting as a result. Packaging grades accounted for 63.9% of total production in 2025, up from 62.9% a year earlier, while graphic grades fell from 22.0% to 20.8%. Europe is not making less paper because demand for packaging collapsed. It is making less paper because the grades that were already in structural decline kept declining, and packaging held its ground.
What this means for planning. If your board or your bank is looking at industry headlines to judge whether a machine investment is sensible, give them the grade-level data instead. A converter running paper bag making lines is exposed to wrapping paper and sack kraft demand, not to the graphic paper market that is dragging the average down. Those are different markets with different trajectories, and the distinction is worth making explicitly in an investment case.
Force 2: PPWR has stopped being legislation and started being a procurement specification
The short answer: the EU Packaging and Packaging Waste Regulation became applicable on 12 August 2026. The requirements that change what a machine has to be able to do land between 2027 and 2030, and machine lead times mean the equipment decision comes first.
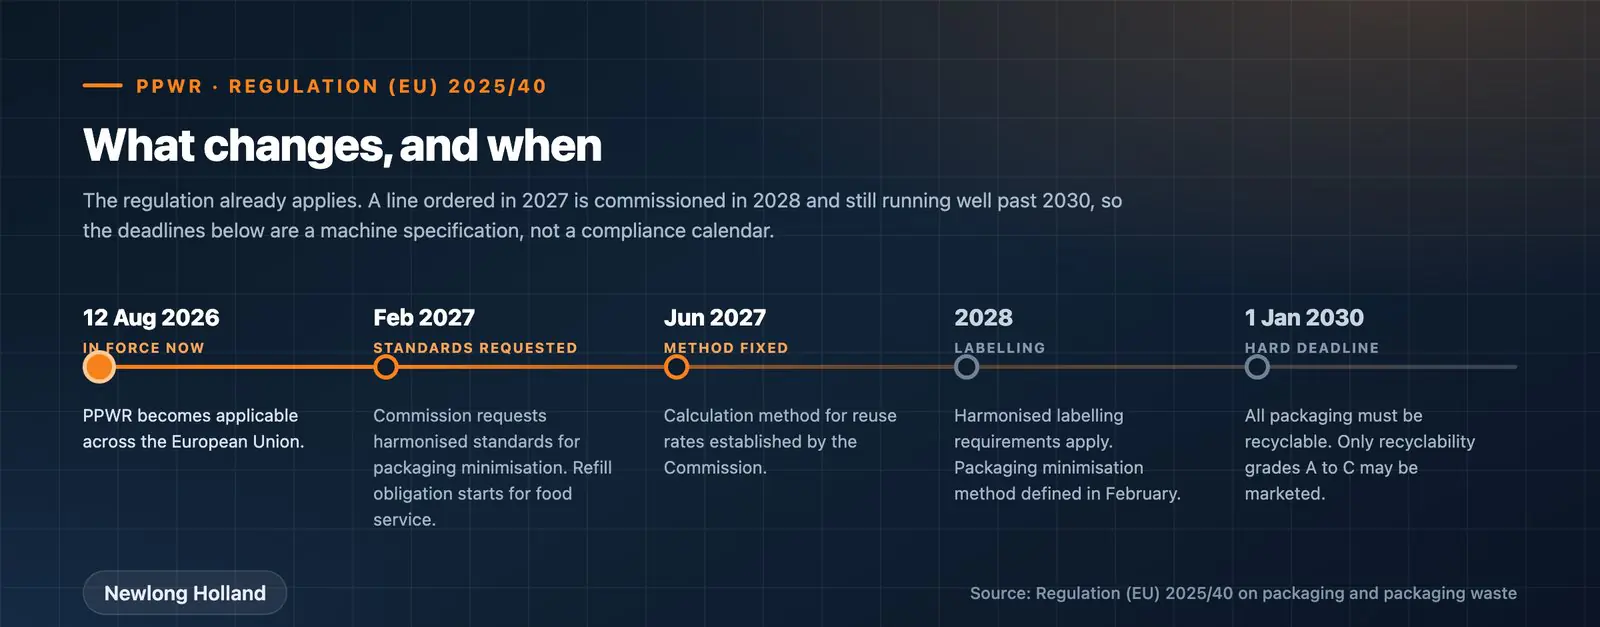
The regulation is no longer a proposal to monitor. It applies now, and the phased obligations that follow are already dated. From 12 February 2027, food service operators must accept containers brought by the customer, and by the same date the European Commission must request harmonised standards for packaging minimisation. The calculation method for reuse rates follows by 30 June 2027. Harmonised labelling requirements apply from 2028, with the minimisation calculation method due by 12 February 2028. Then comes the hard deadline: from 1 January 2030, all packaging placed on the EU market must be recyclable, and only packaging graded A to C for recyclability may be sold.
| Date | Requirement |
|---|---|
| 12 August 2026 | PPWR becomes applicable across the EU |
| 12 February 2027 | Refill obligation for food service; Commission requests harmonised minimisation standards |
| 30 June 2027 | Reuse-rate calculation method established |
| 2028 | Harmonised labelling requirements apply |
| 12 February 2028 | Packaging minimisation calculation method defined |
| 1 January 2030 | All packaging must be recyclable; only recyclability grades A to C may be marketed |
| 1 January 2030 | Maximum 50% empty space in grouped, transport and e-commerce packaging |
What this means for planning. Work backwards from 2030. A line ordered in 2027 will be commissioned in 2028 and will still be running in 2035. It therefore has to handle mono-material constructions and recyclable closures for most of its working life, not as a retrofit but as a specification. The practical questions to put to any supplier now are whether the line can run mono-material paper without a plastic liner, whether the closing method keeps the finished bag inside a single recyclability stream, and whether format changes can be made without new tooling every time a customer reformulates to hit a recyclability grade. We covered the compliance detail in our guide to EU packaging regulations for paper bag manufacturers.
Force 3: demand is moving between end markets, not just growing
The short answer: European paper sack deliveries grew 2.7% in 2025, but the growth is uneven. Cement was the only segment that shrank. Food, milk powder and mineral products all grew more than 5%. A converter anchored to construction is looking at a different decade than one that can produce to food standards.
EUROSAC’s 2025 statistics, published in June 2026, put total European paper sack deliveries at 5.69 billion units, up 2.7%, representing 704,504 tonnes of paper converted, up 2.5%. Building materials excluding cement remains the largest single segment at roughly 2.08 billion sacks, but its growth was modest at 2.2%. The fastest movers were elsewhere.
| End-use segment | Sacks delivered, 2025 (millions) | Change vs 2024 |
|---|---|---|
| Mineral products | 183 | +6.4% |
| Milk powder | 176 | +6.3% |
| Food excluding milk powder | 866 | +5.4% |
| Animal feed | 532 | +3.9% |
| Seeds | 145 | +2.7% |
| Building materials excluding cement | 2,084 | +2.2% |
| Chemical products | 322 | +1.0% |
| Cement | 1,149 | -0.6% |
| Total | 5,690 | +2.7% |
Cement is the second largest segment by volume and the only one in decline. That matters because cement sacks and food sacks are not interchangeable work. Food and milk powder applications bring hygiene requirements, tighter tolerances on print registration for branded packs, more frequent format changes, and in many cases smaller batch sizes. A plant configured for long, uniform runs of construction sacks cannot simply redirect that capacity into the segments that are growing.
What this means for planning. Map your own order book against this table before you specify anything. If the majority of your volume sits in cement, the capacity question is not “how much more of the same” but “what would it take to qualify for food”. That usually means changeover speed, cleanability, and closing options that suit powdered and granular food products, which is where filling and closing systems often become the constraint rather than the bag making line itself.
Force 4: the carbon number per bag has become a procurement question
The short answer: the carbon footprint of a European paper sack fell 9% between 2021 and 2024, from 106.7 to 97.3 grams of CO2e per sack. Large buyers now ask for that figure, and part of it is determined by how efficiently your line runs.
The measurement comes from a life cycle assessment carried out by RISE on behalf of the European Paper Sack Research Group, a joint body of EUROSAC and Cepi Eurokraft, published in April 2026. Alongside the per-sack figure, emissions per tonne of sack kraft paper fell 5%, from 484 to 462 kilograms of CO2e. The drivers were mostly upstream: renewable and low-carbon electricity rose from 29% of supply in 2021 to 54% in 2024, biofuels reached 85% of on-site fuel use, and mills generated 58% of their own electricity. On the converting side, purchased grid electricity emissions fell 44%.
The reason this belongs in a capacity conversation rather than a sustainability report is that the converter controls a real share of the total. Scrap rate is embodied carbon thrown away. Energy per thousand bags is a direct line item. Material efficiency, meaning how little paper it takes to make a bag that still performs, sits with the machine and its tooling. A line that runs 4% scrap instead of 8% does not just improve margin, it improves the number the customer’s procurement team is now asking for.
What this means for planning. Ask for energy consumption and expected scrap rate as named figures in any machine quotation, not as a general claim about efficiency. If a customer is likely to request a footprint declaration in the next three years, and in food and retail supply chains that is now common, those two numbers are the ones you will need to answer with.
Force 5: import pressure means margin has to come from throughput
The short answer: imports reached 7.7% of EU paper consumption in 2025, the highest share on record, and European output remains 7.0% below its 2021 peak. In that environment margin is defended through throughput and changeover time, not price.
Cepi described the pattern as a slow and sustained erosion of Europe’s industrial base rather than a cyclical dip. For converters the practical consequence is that competing on price against imported product is a losing position, because the cost base is not comparable. What is defensible is everything that depends on being close to the customer: shorter lead times, smaller economic batch sizes, faster response to a format change, and reliability of supply. Every one of those is a function of how quickly a line can change over and how consistently it runs.
This is also where the second machine question resurfaces. A single line running above 85% of achievable capacity has no slack to offer a short lead time, because every order queues behind the last one. Adding capacity is often less about total volume than about buying back the flexibility that lets you win the orders imports cannot serve. We set out the utilisation thresholds and the financial case in our guide on when and how to add a second machine.
Four questions to answer before you set your 2027 budget
- Which grades and segments does your order book actually sit in? Compare it against the EUROSAC table above. If more than half your volume is cement, your growth assumption should be flat to slightly negative, whatever the market total says.
- Will your current line still be compliant in 2030? Check mono-material capability and closure recyclability now, not in 2029. Anything ordered in 2027 will still be running then.
- What is your achievable capacity, as opposed to your nameplate capacity? Measure output per shift, actual versus scheduled uptime, changeover frequency and scrap rate over a rolling ninety days. That number is what you plan against.
- Can you state your energy use and scrap rate per thousand bags? If not, you will struggle with the footprint declarations that food and retail customers are already requesting.
Frequently asked questions
Is the European paper packaging market growing or shrinking in 2027?
It depends entirely on the grade. Total European paper and board production fell 1.6% in 2025 to 77.4 million tonnes and declined a further 2.4% in the first quarter of 2026, but that decline is concentrated in graphic papers, down 7.3%, and cartonboard, down 5.6%. Wrapping paper grades used for paper bag production grew 1.0%, and European paper sack deliveries grew 2.7%. For a bag converter, the relevant market is growing modestly, not shrinking.
How many paper sacks are produced in Europe each year?
European paper sack deliveries reached 5.69 billion units in 2025, representing 704,504 tonnes of converted paper, according to EUROSAC statistics published in June 2026. The figure includes estimates for non-EUROSAC members and excludes Ukraine and Russia.
Which paper sack end markets are growing fastest?
In 2025 the fastest growing segments were mineral products at 6.4%, milk powder at 6.3% and food excluding milk powder at 5.4%. Animal feed grew 3.9% and seeds 2.7%. Cement was the only segment to decline, at -0.6%, despite being the second largest by volume.
When does the PPWR actually apply?
The EU Packaging and Packaging Waste Regulation became applicable on 12 August 2026. Further obligations phase in from February 2027 onwards, and the requirement that all packaging be recyclable, with only recyclability grades A to C permitted on the market, takes effect on 1 January 2030.
Does the PPWR mean I need a new bag making machine?
Not necessarily, but it does mean any machine you buy now should be specified against the 2030 requirements rather than today’s. The questions that matter are whether the line can run mono-material constructions without a plastic liner, whether the closing method keeps the finished bag within a single recyclability stream, and how easily formats can be changed as customers reformulate their packaging.
Why is European paper production falling if packaging demand is stable?
Because the decline sits almost entirely in grades unrelated to packaging. Graphic papers for printing and writing are in structural decline and fell 7.3% in 2025. Packaging grades moved 0.2%. As a result packaging grew as a share of total European output, from 62.9% to 63.9%, even while the total fell.
What is the carbon footprint of a paper sack?
A European paper sack averaged 97.3 grams of CO2e in 2024, down 9% from 106.7 grams in 2021. Emissions per tonne of sack kraft paper fell 5% over the same period, from 484 to 462 kilograms of CO2e. The figures come from a life cycle assessment by RISE for the European Paper Sack Research Group, a joint body of EUROSAC and Cepi Eurokraft.
How much of a paper bag’s carbon footprint can a converter influence?
Most of the footprint originates in paper production, but the converting stage is not negligible and it is the part you control. Scrap rate, energy consumption per thousand bags and material efficiency all sit with the line and its tooling. Between 2021 and 2024 sack converters cut purchased grid electricity emissions by 44%.
Should I invest in new capacity in 2027 or wait?
Base the decision on achievable capacity rather than the market outlook. If a line has run above 85% of achievable capacity for three consecutive months, has no slack for maintenance, and overtime has become a standing item on the schedule, the case is usually already made. If utilisation sits between 70 and 85%, there is normally more to gain from reducing changeover time than from adding a machine.
How are imports affecting European paper converters?
Imports reached 7.7% of EU paper consumption in 2025, the highest share recorded, and European production remains 7.0% below its 2021 peak. Competing on price is difficult because the cost bases differ. The defensible advantages are proximity based: shorter lead times, smaller economic batch sizes and faster response to format changes.
What is the difference between wrapping paper and sack kraft paper?
Wrapping paper is the broader Cepi statistical category covering grades used for paper bag production. Sack kraft is the specific high-strength kraft grade used for multiwall industrial sacks, where burst and tear resistance matter because the filled sack must survive handling and palletising.
Can one bag making line serve both construction and food customers?
Sometimes, but it is rarely straightforward. Food applications bring hygiene requirements, tighter print registration tolerances, more frequent format changes and often smaller batches. A line optimised for long uniform runs of construction sacks will lose a significant share of its effective capacity to changeovers if it is redirected into food work without being reconfigured for it.
Planning capacity for 2027
The data says the market for paper bags is growing slowly, shifting between end uses, and about to be reshaped by a regulatory deadline that arrives before most machines bought today reach mid-life. That is a case for planning deliberately rather than either rushing or waiting.
If you are working through a capacity decision for 2027, our engineering team will review your run-length, format and utilisation data and tell you honestly whether the answer is a new line, a reconfiguration of the one you have, or neither. Get in touch and we will start from your numbers.